Beginner guide
How to read crypto charts for beginners
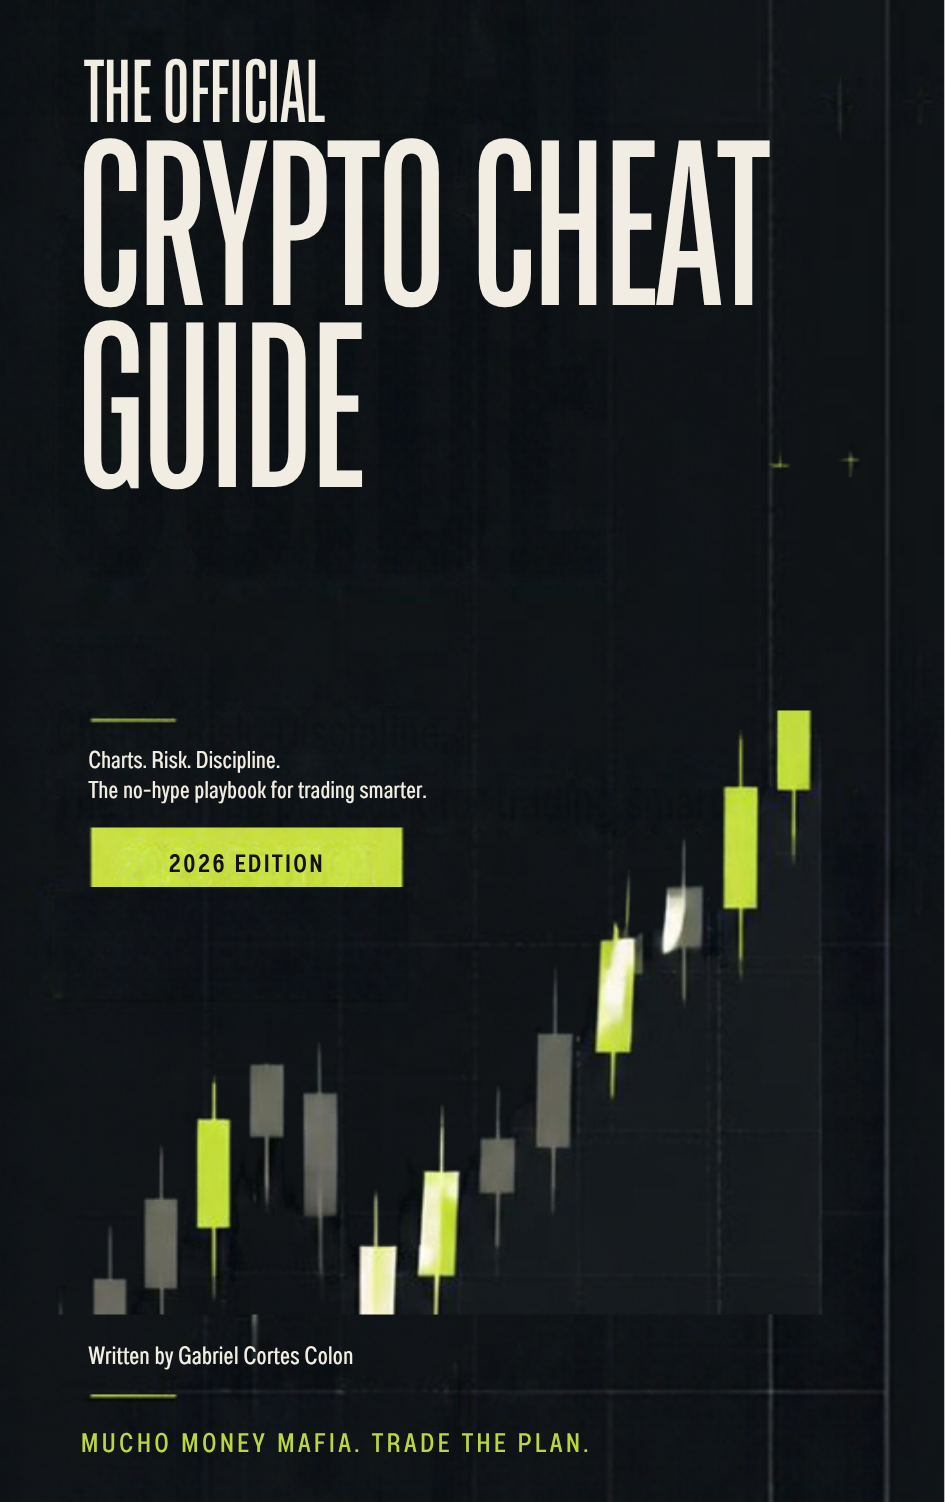
Candles, levels, trends, risk math and a pre-trade checklist — everything a beginner needs to stop gambling and start trading with a system. Read the tape, not the noise.
Educational content only. Not financial advice. Trading crypto involves risk, including the loss of your entire investment.
00Rule zero: risk first
Charts tell you where the market has been. Risk rules decide whether you're still around to use them.
- Know your exit before your entry. Decide the price that proves you wrong before you click buy.
- Risk a small, fixed slice. Many traders cap risk at 1–2% of their account on any one trade.
- Only trade money you can afford to lose.
- A plan beats a feeling. If you can't write your reason in one sentence, you don't have a trade.
01Reading candlesticks
Each candle shows one time period (1 minute, 1 hour, 1 day) and records four prices: open, high, low and close.
- Body: the span from open to close. Green usually means price closed higher than it opened; red means lower.
- Wicks: the high and low of the period. A long wick means price went there but got pushed back.
- A small body with wicks (a doji) means the market was undecided that period.
One candle is a clue, not a signal. Context decides what it means.
02Support and resistance
Support is where price stopped falling before — the floor. Resistance is where price stopped rising before — the ceiling. Think zones, not exact lines.
- The more times a zone has reacted, the more traders watch it. Each test can also weaken it.
- Wait for a candle to close through a level before calling it a breakout. A wick alone proves little.
- Role reversal: broken resistance can become support, and broken support can become resistance.
03Trends and timeframes
- Uptrend: higher highs and higher lows. Downtrend: lower highs and lower lows. Range: bouncing between two levels.
- Start on a higher timeframe (daily or weekly) for the big picture, then zoom in to plan your entry.
- A trend is context, not a promise. Trends end, and no pattern works every time.
Don't fight the bigger picture on a small chart. Check the timeframe above first.
04Volume and moving averages
- Volume is how much was traded in a period. Moves on rising volume have more participation; breakouts on thin volume fail more often.
- A moving average is the average close over a set number of periods. Common references: 20, 50 and 200.
- Averages lag. Use them for context, not predictions — and don't stack ten indicators.
05Risk math
Position size = (Account × Risk %) ÷ (Entry price − Stop price)
Example (for learning only): $2,000 account, 1% risk = $20 max loss. Entry $50, stop $47 = $3 risk per coin. $20 ÷ $3 ≈ 6.67 coins (about a $333 position). If the stop hits, you lose about $20 — already priced into the plan.
| Reward : Risk | Break-even win rate |
|---|
| 1:1 | 50% |
| 2:1 | 33% |
| 3:1 | 25% |
Before fees and slippage. Break-even win rate = 1 ÷ (1 + reward-to-risk).
06The pre-trade checklist
- What is the trend on the higher timeframe?
- Where are the nearest support and resistance zones?
- Where is my stop — the price that proves me wrong?
- If I'm stopped out, is the loss within my risk rule?
- Is my target at least 2× what I'm risking?
- Can I write my reason in one sentence?
- Am I following a plan, or chasing a candle, a tweet or a feeling?
If you can't check every box, you wait. Waiting is a position too.
07Beginner mistakes to avoid
- Buying after a big green candle out of FOMO.
- Trading with no stop, or moving the stop farther away when the trade goes against you.
- Oversizing, revenge trading and overtrading out of boredom.
- Following tips and influencer calls instead of your own plan.
- Skipping the trade journal.
?Frequently asked questions
How do you read a crypto chart as a beginner?
Start on the daily or weekly timeframe to find the trend, mark support and resistance zones, read the latest candles for context, and decide your stop and position size before entering.
What do green and red candles mean?
A green candle usually means price closed higher than it opened during that period. A red candle means it closed lower. The wicks show the high and low.
What is support and resistance?
Support is a zone where price stopped falling before. Resistance is a zone where price stopped rising before. Think zones, not exact lines.
How much should a beginner risk per trade?
Many traders cap risk at 1–2% of their account on any one trade, and only trade money they can afford to lose.
Educational content only. Not financial advice.